Fixes to Wysopal’s Application Security Debt Metric
In two recent blog posts (here and here), Chris Wysopal (CTO of Veracode) proposed a metric called “Application Security Debt”. I like the general idea, but I have found some problems in his method. In this post, I suggest corrections that will be both more credible and more accurate, at least for half of the formula. The second half is harder to do right and needs more thinking.
Overview
Application Security Debt is based on the concept of “technical debt” proposed by Ward Cunningham (a programmer who developed the first wiki program): describes it like this:
Shipping first time code is like going into debt. A little debt speeds development so long as it is paid back promptly with a rewrite… The danger occurs when the debt is not repaid. Every minute spent on not-quite-right code counts as interest on that debt. Entire engineering organizations can be brought to a stand-still under the debt load of an unconsolidated implementation, object-oriented or otherwise.
Chris adds:
The cost of technical debt is the time and money it will take to rewrite the poor code after you ship and bring it back to the quality required to maintain the software over the long haul.
Here is Chris’ summary of Application Security Debt:
Security debt is similar to technical debt. Both debts are design and implementation constructions that have negative aspects that aggregate over time and the code must be re-worked to get out of debt. Security debt is based on the latent vulnerabilities within an application. Application interest rates are the real world factors outside of the control of the software development team that lead to vulnerabilities having real cost. These factors include the cost of a security breach and attacker motivation to discover and exploit the latent vulnerabilities.
Chris’ second post describes a financial model that estimates the cost of Application Security Debt. Framing the metric in financial terms will presumably help managers compare the cost of the “debt” to the cost of developing more secure software or costs of fixing the vulnerabilities. (Note: Veracode provides a range of application security testing services [link to http://www.veracode.com/solutions/application-security-testing.html no longer works] , so they have an interest in economically justifying their services. This isn’t a criticism of Veracode, Chris, or his proposal. Just a reality.)
Chris’ model is focused on the simplest case where the application developer and application user is the same organization, so that it bears the costs of development, maintenance, and also any security breaches that result. Starting with the simplest case is a great idea when proposing a new method. So far so good.
Chris defines his financial model this way:
The basic financial model for security debt is monetary risk that can be expressed as expected loss. The formula for expected loss is event likelihood X impact in dollars. Event likelihood is based on the makeup of vulnerabilities in the application and the likelihood that the vulnerabilities will be discovered and exploited. The impact is the cost of a security breach based on an exploit of one of those vulnerabilities. [Emphasis in original]
This is, of course, a version of the bottom-up Annualized Loss Expectancy (ALE) formula for individual risk elements:
- ALE = Single Loss Expectancy X Annual Rate of Occurrence
(Mike Rothman recently crapped on all “risk metrics” by lumping them all into the ALE formula. I’ll critique ALE and Mike’s post in a separate blog post.)
ALE issues aside, I think Chris is making mistakes in his definition of Application Security Debt that will lead to serious confusion.
Debt = Expected Principal + Interest Costs
Chris made a mistake when he defines monetary value of the Application Security Debt as expected loss due to security breaches. Instead, the ‘Principal’ part of the debt formula is the cost of fixing security problems beyond what is budgeted. Chris had it right in his summary in the first article:
The cost of technical debt is the time and money it will take to rewrite the poor code after you ship and bring it back to the quality required to maintain the software over the long haul.
Expected losses are in the category of “Interest Costs” as Chris said in his summary:
Application interest rates are the real world factors outside of the control of the software development team that lead to vulnerabilities having real cost.
Putting this together in simple language:
“Application Security Debt is a ‘loan’ with variable principal which could range from 0% to 100% of your original project costs. The ‘principal’ is what you’ll eventually have to pay to fix security bugs or rewrite the code. It also has varying and uncertain ‘interest costs’, which are the costs of security breaches due to these vulnerabilities. This includes the possibility of the mother-of-all balloon payments (i.e. a huge loss event).”
The good news is that Expected Principal is relatively easy to estimate with good accuracy and without a lot of outside data. The not-so-good-news is that Interest Cost is a bear to estimate.
Estimating ‘Expected Principal’
For simplicity, let’s assume that cost of fixing code (above the budgeted costs) occurs in discrete increments, F:
- Zero (i.e. your debt is ‘forgiven’)
- Minor fixes and patches (‘Principal’ = 10% increase in project cost)
- Major fixes and patches (‘Principal’ = 25% increase in project cost)
- Substantial rewrite (‘Principal’ = 50% increase in project cost)
- Total rewrite (‘Principal’ = 100% increase in project cost, or more)
Thus, the best case is that you owe no principal and the worst case is that you owe principal equal to the entire cost of the project. You could include other factors such as external costs of schedule delays, costs of rehiring your programmers after you fire them all :-), or what ever. My point is that these costs are not open-ended, but are a multiplier on your original development costs.
The Expected Principal (EP) is equal to each of these cost scenarios multiplied by their probability of management choosing that option:
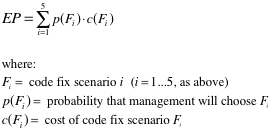
For example, if the original cost of the application development project is $1 million, and there is 5% chance of Zero costs, 80% of Minor code fix costs, and 15% chance of Substantial rewrite costs, then the Expected Principal would be $155,000, or 16% of the original cost.
This is important: Expected Principal is ultimately determined by management decisions and ‘threshold of pain’. This means that the value of p(F), above, is a subjective probability. It would be an ideal metric to estimate using prediction markets (PMs). (PMs have been used successfully in software development to estimate shipment dates and defect rates, for example.)
Another implication: you don’t need to accurately forecast future loss events or their economic impact to get a decent estimate of Expected Principal. Instead, you only need to estimate the Interest Costs very roughly to determine which code fix scenario is most likely. You could even estimate p(F) by setting thresholds for the number and severity of vulnerabilities discovered by certain levels of effort. Better, you could combine these methods to ‘triangulate’ on estimates of p(F).
To calibrate these subjective probability estimates, it would be very helpful to collect historical data on the % of applications that have some level of rewrite or schedule delay due to security problems. (Hint hint!)
Estimating ‘Interest Costs’ on the Debt will be Hard
The second part of the Application Security Debt formula is ‘Interest Costs’. This is where things get hairy. All the members of the ALE family of risk calculations have a similar flaws: 1) prodigious data requirements and 2) propagation of uncertainty through the calculations. Furthermore, some suffer by using only mean values and ignoring extreme values (i.e. the “tails” of the probability distribution curves).
Chris acknowledges these issues, at least the requirement for more and better data:
Now you are probably thinking that this is getting a little tenuous and it is. We need better data on likelihood type and likelihood of an application breach by industry and other factors like company size.
Data issues aside, I think there are flaws in his use of ALE and calculation methods. Here’s one thought experiment to show how it could lead to the wrong conclusions, in my opinion.
Let’s use Chris’ ‘baseline expected loss’ table, where he calculates the expected loss for each type of vulnerability. Imagine that we are comparing two similar applications, A and B. Assume that each project is expected to have the same number of vulnerabilities, five each. Let’s say the development cost of each project is $1 million. Application A has five SQL injection vulnerabilities while application B has one SQL Injection vulnerability and four Remote File Inclusion vulnerabilities. Doing the calculations:
- A’s expected losses = $19,220,000
- B’s expected losses = $5,074,080
Does project A really have four times more risk than project B? Probably not. From what I know, the number of vulnerabilities in an application is not proportional to the likelihood that the application will be breached. Instead, I’d guess that the likelihood of being breached is a function of where the application is in the IT architecture, how accessible it is, how important it is to attackers, etc.
Also, there’s the ‘weakest link’ effect: “given enough random attackers or one persistent attacker, it only takes one vulnerability to lead to a breach”. Assuming all SQL Injection vulnerabilities are equally discoverable and equally exploitable, then we should estimate that application B with one SQL Injection vulnerability is just as likely to get breached as application A with five, all other things being equal.
(I confess I’m not an expert in application security or vulnerability analysis, so these comments are my interpretation of what others have written or said.)
Even if my logic here is flawed somewhat, my main point is that the relation between number of vulnerabilities and likelihood of being breached is non-linear and it may even be indeterminate if contextual factors dominate.
This example also hints at another severe weakness in the ALE method – it ignores correlation and dependence between risk elements and factors. We know from forensic analysis and the DBIR that severe security breaches involve a sequence of exploits and attacks. This means that the likelihood of breach in one application is dependent on the likelihood of breach in other applications and systems. An application might appear unimportant, but it might be a stepping-stone to other applications, databases, and networks.
It’s hard to account for all these factors and influences together without some sort of over-arching model for enterprise-level information security and risk. Basically, you are looking for the ‘risk contribution’ of those specific application vulnerabilities to total costs, now and in the uncertain future. Formally, the ‘Interest Cost’ for any given set of application vulnerabilities is the difference between the Total Cost of Security (TCoS) in two possible worlds: World 1) application A has X vulnerabilities, vs. World 2) application A does not have X vulnerabilities (or if application A is not deployed at all).
What we really need are some short-cut approximations for this that doesn’t require a complete data set and risk estimates for the whole enterprise. One approach I’m interested is in using modern AI methods (data mining, machine learning, inference methods). This is on-going research.
Summary
I’m glad Chris proposed his Application Security Debt metric. I hope my post has been helpful in correcting some of the errors, as I see them. The good news is that the “Expected Principal” component of the metric looks like it can be estimated fairly easily and with good accuracy. On the other hand, the “Interest Cost” component needs a lot of work. I’m happy to collaborate with Chris or anyone else who wants to work on this.
Very nice, Russell. I think you nailed it here:
“Expected Principal is ultimately determined by management decisions and ‘threshold of pain’. This means that the value of p(F), above, is a subjective probability.”
Just because you know that there’s a vulnerability, it doesn’t mean that it needs to be fixed (hey, there’s a WAF rule for that!), or that it will be fixed. The costs of remediation vary so widely based on labor costs, dependencies on other applications, and so on, that management is already making that calculation in their heads when they decide to fix post-development or not. (Hint: they do it every day today, and they’re not using formulas.) I think you would need a lot of historical data IN THAT ENVIRONMENT, with all of the equivalent budget numbers and historical risk decisions, to be able to say how much cheaper it would have been (and will be in the future) to avoid those vulns to begin with, or fix them in development.
@shrlu — yes, that’s exactly my point. The “Expected Principal” is not a direct function of number of vulnerabilities, or even severity. It’s a management decision as to whether they are going to be fixed or not, and how (patch vs. rewrite vs. other).
As for needing “a lot of historical data”, I disagree. Sure, that might shed a little light, especially regarding how accurate management cost forecasts are relative to security fixes. But I’m arguing that a fairly simple multiplier formula could be created that would cover most cases, at least good enough for this exercise. After all, the goal is to estimate Application Security Debt to some degree of accuracy. For example, you could get around a lot of the variability in labor costs by just assuming the use of the most expensive resources. You could also assume a rewrite in many cases, even if the actual management decision is to fix and patch. These sort of simplifications should result in an estimate that is fairly reliable (i.e. worst case) and therefore usable for decision-making.
This is very interesting stuff! I think we’ll do better if we estimate expected principal as a function of issue type. For example, fixing a SQL injection is probably localized, and so may be easier than fixing insufficient authorization issues.
This is fun from a hobbyist or academic perspective. However I won’t incorporate into a real sdlc. Product teams already have mechanisms to prioritize dev tasks and bugs. I think we should focus on making sure we align security likelihood and impact definitions into the existing prioritization scheme and complement with app sec metrics.
@Jared — you bring up a good point that deserves to be front-and-center: when would this metric matter? When is it worth the effort?
As I understand your comment, you are asserting that the normal management and team practices in the SDLC are sufficient to prioritize and resolve AppSec vulnerabilities.
That certainly might be true for some teams. If so, then Application Security Debt and similar metrics are overkill, as you say.
But, why are AppSec results so poor and not improving, by all appearances? (I’ve never heard any expert say that AppSec was just fine and also getting better.)
Could it be that, in most situations, the SDLC and associated tools, processes, and team organization need to be significantly changed and these changes might be costly?
Let’s say that the CIO or VP of R&D is given a proposal to dramatically improve AppSec. Let’s say this proposal includes things like:
– Sending all developers and testers through security training
– Buying new tools and services (maybe including Veracode’s)
– Changing the release criteria, which increases the chances that releases will be delayed unless security dramatically improves.
– Changes to defect tracking, prioritization, and remediation criteria
– Implementing a security metrics program
(Feel free to come up with your own list)
In other words, the proposal would be a bundle of systemic changes involving significant investments and changes to business practices. How will the CIO or VP decide if this proposal should be funded or not? The proposed AppSec Debt metric might be useful in this decision context.
Adam or others would have more to add to this discussion since they’ve been leading change in SDLC in their organizations.
This is all too stilted. With my past 3 experiences, we sold fixing detected critical security defects to senior management and dev leads simply by asking them if they wanted critical defects to go into product versus launching.
The question is simple and the answer revealing.
A company chooses to fix the problems does not want that level of exposure versus a company that can care less. Our job is simple once we figure out what kind of company that we work out.
Enough said.