Happy Banned Books Week!
 Quoting Michael Zimmer:
[Yesterday was] the start of Banned Books Week 2009, the 28th annual celebration of the freedom to choose what we read, as well as the freedom to select from a full array of possibilities.
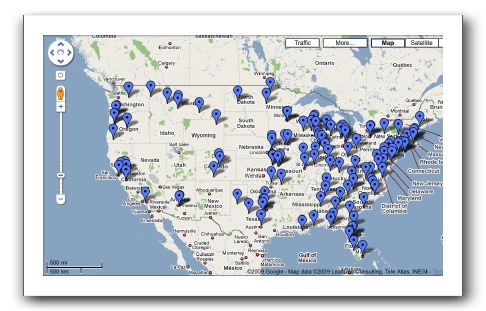
Hundreds of books are challenged in schools and libraries in the United States each year. Here’s a great map of challenges [link to http://bannedbooksweek.org/Mapofbookcensorship.html no longer works] from 2007-2009, although I’m sure it under-represents the nature of the problem, as most challenges are never reported. (Note the West Bend library controversy is marked on the map.)
According to the American Library Association [link to http://www.ala.org/ala/issuesadvocacy/banned/frequentlychallenged/21stcenturychallenged/2008/index.cfm no longer works], there were 513 challenges reported to the Office of Intellectual Freedom in 2008.
I’m somewhat surprised by how many bluenoses dots there are in the northeast. Does anyone know of a good tutorial that would help me to re-map the data against population?
One local library’s way of celebrating Banned Books Week was to put up a display of banned books for people to take out and read. They chose several literary classics for this display, rather than the often obscure books that get banned in various cities and towns. And why should the Northeast have fewer idiots than other places? Like intelligence, idiocy is randomly distributed throughout the population.
Without seeing a map which shows population proportional to area, one cannot see whether the Northeast has more idiots per acre than anywhere else. I think this is what Adam was asking about. Such a map is called a cartogram (or anamorphic map), but despite seconds of searching, I cannot find a free source for tools to create one (other than GRASS, which I guess can but it rather huge and has a learning curve).
I couldn’t let it go.
Code purportedly at:
http://www.santafe.edu/~mgastner/cartogram/cartogram.html [link no longer works]
http://people.cas.sc.edu/hardistf/cartograms/ [link no longer works]
http://scapetoad.choros.ch/ [link no longer works]
@beri Idiocy may be randomly distributed across the population, but the population is not randomly distributed across the land. Whether the non-random geographic dispersion is in any way related to idiocy is the question.
Regarding the Northeast, there’s no evidence that higher education levels and a “liberal” political mindset prevent thought control. It’s not at all clear that liberals are any more tolerant than conservatives of what they don’t like: as evidence, look at campus speech codes.
The common theme is that some folks simply know that certain topics should be forbidden. Geography or political ideology don’t really have anything to do with it.
It’s possible that in highly conservative areas like the Bible Belt, librarians know better than to even put controversial material in the stacks.