The Fog of Reporting on Cyberwar
There’s a fascinating set of claims in Foreign Affairs “The Fog of Cyberward“:
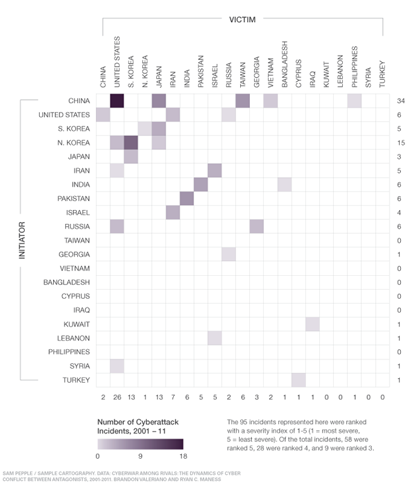
Our research shows that although warnings about cyberwarfare have become more severe, the actual magnitude and pace of attacks do not match popular perception. Only 20 of 124 active rivals — defined as the most conflict-prone pairs of states in the system — engaged in cyberconflict between 2001 and 2011. And there were only 95 total cyberattacks among these 20 rivals. The number of observed attacks pales in comparison to other ongoing threats: a state is 600 times more likely to be the target of a terrorist attack than a cyberattack. We used a severity score ranging from five, which is minimal damage, to one, where death occurs as a direct result from cyberwarfare. Of all 95 cyberattacks in our analysis, the highest score — that of Stuxnet and Flame — was only a three.
There’s also a pretty chart:

All of which distracts from what seems to me to be a fundamental methodological question, which is “what counts as an incident”, and how did the authors count those incidents? Did they use some database? Media queries? The article seems to imply that such things are trivial, and unworthy of distracting the reader. Perhaps that’s normal for Foreign Policy, but I don’t agree.
The question of what’s being measured is important for assessing if the argument is convincing. For example, it’s widely believed that the hacking of Lockheed Martin was done by China to steal military secrets. Is that a state on state attack which is included in their data? If Lockheed Martin counts as an incident, how about the hacking of RSA as a pre-cursor? There’s a second set of questions, which relates to the known unknowns, the things we know we don’t know about. As every security practitioner knows, we sweep a lot of incidents under the rug. That’s changing somewhat as state laws have forced organizations to report breaches that impact personal information. Those laws are influencing norms in the US and elsewhere, but I see no reason to believe that all incidents are being reported. If they’re not being reported, then they can’t be in the chart.
That brings us to a third question. If we treat the chart as a minimum bar, how far is it from the actual state of affairs? Again, we have no data.
I did search for underlying data, but Brandon Valeriano’s publications page [link to http://dl.dropbox.com/u/5471522/papers.htm no longer works] doesn’t contain anything that looks relevant, and I was unable to find such a page for Ryan Maness.