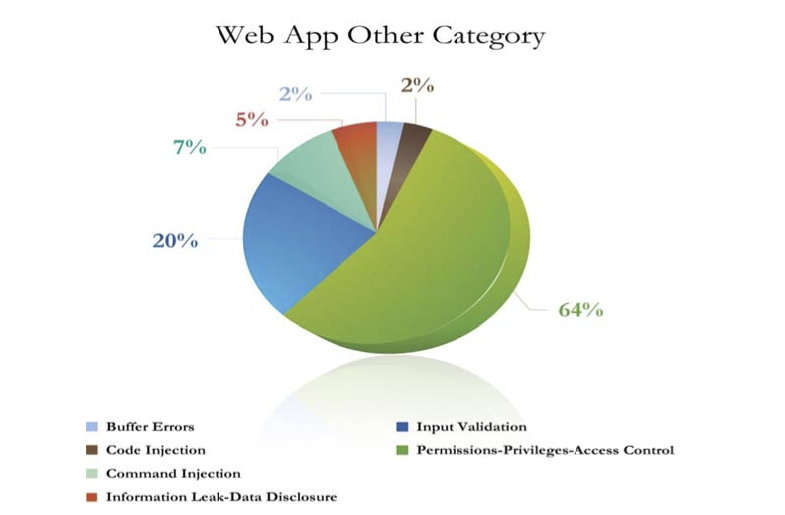
New low in pie charts
It’s not just a 3d pie chart with lighting effects and reflection. Those are common. This one has been squished. It’s wider than it is tall.

While I’m looking closely, isn’t “input validation” a superset of “buffer errors” “code injection” and “command injection?”
You can get the “Application Security Trends report for Q1-Q2 2010” [link to http://www.cenzic.com/resources/reg-not-required/trends/ no longer works] from Cenzic. I’ve been generally impressed by the founders and other work I’ve seen for a long time, and I look forward to beautiful and effective data presentation in their future reports.
I don’t get it, Adam. Do you like it or hate it? What do you like or hate?
I hate these statistics. The reality of our situation was discussed by FX long ago: there is a massive shift away from parser bugs (especially OS default parsers — userland or kernel) and towards input-output bugs. This is especially true for security-related bugs.
You can’t just drop an XML file on the desktop and create a billion laughs anymore. But you can XPath inject a web application and store Javascript in an XML data store where it will be Lucky-Punched onto an unsuspecting user of a legitimate web app, who will then search for more XPath injections in order to repeat this same attack.
Data validation is a bad future defense for us to lean on. If only a shrinking three percent of the world’s data can even be validated (because it has a specification), then how are we supposed to scale this defense?
Adam,
“input validation” is definitely a superset of “buffer errors” “code injection” and “command injection” in my opinion when applied to Web Applications.
Andre,
I think Adam’s point is that use of 3D, lighting effects, the reflection and the fact that the pie chart is not circular distract from the presentation of the data.
The chart is “not circular” because the 3D effect’s viewing angle is not from immediately above the pie. Hence, the “pie” is (correctly) foreshortened.
IOW, it may be hideous, but it is realistic.
A valiant try, but the viewing angle is clear from the shape of the 3-d, and doesn’t account for this effect. Which is also not present in other pie charts in the report.
Crap! My mind made up its own viewing angle to make order of what it was seeing.
The moral: Never ascribe to physics that which is adequately explained by stupidity!